


Dashboard Control: 7 Powerful KPIs Every Manufacturing CEO Must Track
From Coimbatore pump factories and Tirupur garment units to Chennai auto-component plants and Bengaluru precision engineering shops — these are the seven numbers that define whether your factory is winning or quietly falling behind.
“The Coimbatore factory owner who checks WhatsApp for production updates at 7 AM is making the same mistake as the Chennai plant head who waits for the Monday morning Excel report. In 2026, both are too late.”
South India’s manufacturing ecosystem is one of the most impressive in Asia. Coimbatore — the Manchester of South India — hosts more than 25,000 manufacturing units and supplies over 40% of India’s pumps and motors. Tamil Nadu powers Chennai’s automotive corridor, Tirupur’s global garment exports, and a foundry network that stretches from Salem to Hosur. Karnataka’s Bengaluru and Tumkur are home to aerospace, precision engineering, and machine tool manufacturers. Andhra Pradesh and Telangana are building out pharmaceutical, food processing, and electronics clusters at speed.
These are formidable strengths. But walk into most of these factories and ask the owner a simple question: “How is your factory performing right now — not yesterday, not last week — right now?” And you’ll see the same scene play out: a flurry of phone calls, someone pulling up an Excel file, a vague answer about “production going smoothly.”
That gap — between the ambition of South India’s manufacturers and the visibility they actually have into their operations — is exactly what this blog is about. These are the 7 KPIs that need to live on a single, live dashboard on every South Indian manufacturing CEO’s screen.
The South India Manufacturing Landscape in 2026
South India is now the fastest-growing manufacturing region in India, clocking a 7.72% CAGR to 2031. Tamil Nadu alone attracted USD 6.2 billion in electronics FDI in FY 2025, while Karnataka’s aerospace hub and Andhra Pradesh’s pharma clusters are scaling rapidly. The industrial corridors of Hosur, Sri City, and Tumkur are emerging as new manufacturing powerhouses.
Yet the vast majority of South Indian manufacturers — particularly the MSME backbone that drives this ecosystem — still operate without real-time visibility into their own performance. The opportunity to gain competitive edge through data is enormous, and largely untapped.

What it is: OEE is the single most important number on any manufacturing dashboard. It multiplies three things together — how available your machines are (Availability), how fast they’re running versus their rated speed (Performance), and how much of what they produce passes quality first time (Quality) — into one percentage that tells you the whole story.
In Coimbatore’s pump and textile machinery clusters, the average OEE sits between 52–60% — well below the world-class benchmark of 85%. A foundry unit in Salem running three shifts with frequent changeovers and aging machinery might be operating at 45% OEE without even knowing it. Every 5% improvement in OEE is the equivalent of gaining a full extra shift of capacity — without buying a single new machine.
What it tells a South Indian CEO: A Coimbatore pump manufacturer running at 58% OEE has 27 percentage points of hidden capacity sitting idle. That’s not a capital investment problem — it’s a visibility and management problem. A live OEE dashboard that also shows the top downtime cause for the current shift is worth more than a new CNC machine.

What it is: First Pass Yield (FPY) measures the percentage of units that come off your production line meeting full quality specifications — no rework, no rejection, no second pass. It’s the most honest measure of your process capability, and it has a direct, calculable relationship with your cost per unit and customer complaint rate.
For Tirupur garment manufacturers exporting to European buyers, FPY is increasingly a contractual metric — buyers are now auditing First-Time-Right rates directly. For Chennai auto-component suppliers to Tier-1 OEMs, a falling FPY is the fastest way to lose a contract. In a precision engineering shop in Hosur, a 3% rejection rate on a high-value component run can wipe out an entire batch’s margin overnight.
What it tells a South Indian CEO: Every rejected unit costs you twice — once to produce, once to rework or scrap. For a Coimbatore pump component manufacturer producing 500 units per shift, even a 5% rejection rate means 25 units reworked every shift — roughly 6,000 rework operations per year. A live FPY dashboard catches the decline the day it starts, not the month it shows up in your P&L.

What it is: Unplanned downtime tracks every production stoppage that wasn’t scheduled — machine breakdowns, tooling failures, power cuts, raw material stoppages. Your dashboard should show not just the total hours lost, but the Pareto of causes — what’s responsible for the most lost time, ranked by impact.
In Coimbatore’s textile machinery cluster, spindle bearing failures and motor breakdowns are the #1 cause of unplanned downtime — and most factories find out about them when the line stops, not before. In Chennai’s auto-component plants, tool breakage and coolant system failures regularly interrupt CNC runs. A live downtime tracker with cause codes doesn’t just tell you how much time was lost — it tells your maintenance team what to fix this week to prevent next week’s stoppage.
World-class plants keep unplanned downtime below 5% of scheduled production time. Most South Indian SMEs we’ve spoken to are running at 12–20% — which means roughly 1 in 6 to 1 in 5 production hours is unplanned downtime. That is a maintenance strategy problem, not a machine quality problem.
What it tells a South Indian CEO: The most valuable thing your dashboard can show here isn’t the total downtime hours — it’s the single biggest recurring cause. For most South Indian factories, fixing the top 2 downtime causes eliminates 60–75% of all unplanned production loss.

What it is: On-Time Delivery measures the percentage of customer orders despatched or delivered by the committed date. It’s the metric your customers measure you on — even if they’ve never told you so explicitly. A good on-time delivery rate is 95% or higher. World-class operations target 98%+.
For Tirupur knitwear exporters supplying global fast-fashion brands, delivery date adherence is contractual — late shipments trigger penalty clauses and can cost relationships built over decades. For Coimbatore pump suppliers to irrigation projects and industrial clients, delivery delays cascade into project penalties for the end customer. For Chennai auto-component suppliers in JIT supply chains, a single delayed delivery can halt a Tier-1 OEM line. OTD is not a logistics KPI — it’s a factory performance KPI that shows up at the gate.
What it tells a South Indian CEO: A declining OTD rate is almost never a logistics failure — it’s a production scheduling failure that arrives at the dispatch gate. When this number drops, look at your schedule adherence (KPI 7), your raw material availability, and your unplanned downtime. The truck was never the bottleneck.

What it is: Cost Per Unit is the total manufacturing cost — raw materials, direct labour, machine time, power, overheads — divided by the number of good units produced. It is the most direct measure of operational profitability available to a manufacturing CEO, and it connects every shop floor decision directly to your margin.
Raw material costs in Coimbatore’s foundries and precision engineering shops are highly volatile — iron, aluminium, and copper prices fluctuate monthly. In Tirupur’s garment units, yarn costs and wage rates shift seasonally. Most South Indian SME owners know their selling price intimately but do not know their real cost per unit in real time. The gap between these two numbers — and whether it’s expanding or contracting — is your margin story. A weekly cost-per-unit dashboard tells you that story before it appears in your annual accounts.
With raw material prices volatile and competition intensifying from Gujarat and Maharashtra manufacturing clusters, South Indian manufacturers cannot afford to discover margin erosion at year-end. A live cost-per-unit KPI tracked weekly gives you the ability to catch and respond to margin pressure in real time — adjusting pricing, procurement, or process efficiency before the problem compounds.
What it tells a South Indian CEO: When cost per unit rises unexpectedly, your dashboard needs to tell you why — was it a material price spike, higher scrap/rework, lower throughput, or increased overtime? That diagnostic capability is what separates a useful cost KPI from a number that just tells you something is wrong without telling you what.
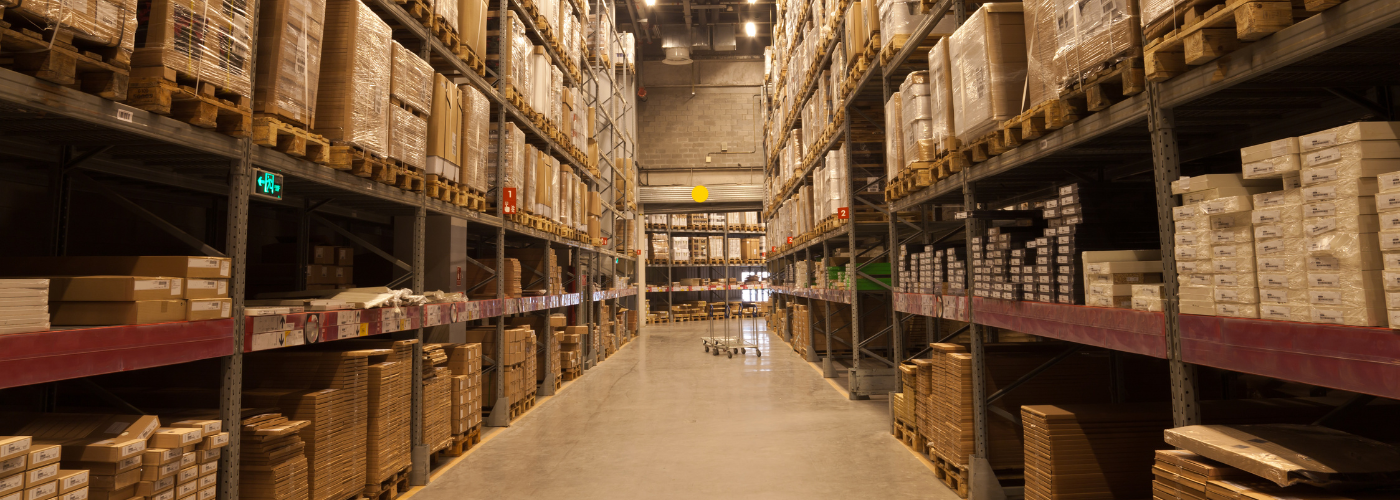
What it is: Inventory Turnover measures how many times your total inventory — raw materials, work-in-progress, and finished goods — is cycled through in a given period. A low turnover ratio means money is sitting idle in your warehouse. A high ratio means your procurement and production are tightly synchronised with demand.
In Coimbatore’s pump manufacturing cluster, over-purchasing of castings and motor components is one of the most common working capital traps — raw material procurement driven by supplier minimum order quantities rather than actual production schedules. In Salem’s foundry belt, WIP inventory sitting between casting and machining stages for weeks at a time ties up significant working capital. In Bengaluru’s precision engineering shops, slow-moving finished goods for project-based customers are a persistent balance sheet problem. For a South Indian MSME with credit lines under pressure, a poor inventory turnover ratio can be the difference between cash flow stability and a working capital crisis.
What it tells a South Indian CEO: Low inventory turnover is rupees sitting on shelves instead of circulating in your business. For an MSME manufacturing unit with ₹1 crore of average inventory and a turnover ratio of 4×, moving to 8× effectively frees up ₹50 lakhs of working capital — without a single rupee of new investment. That’s the power of this KPI.

What it is: Schedule Adherence measures how closely your actual production output tracks against your planned targets — daily, weekly, and monthly. It is the bridge KPI: the one that connects shop floor performance to customer commitments and cash flow. When schedule adherence is consistently high, everything downstream — delivery, invoicing, working capital — runs on time.
In Tirupur’s knitwear units, seasonal demand spikes from export orders make production planning — and adherence to that plan — a make-or-break capability. Missing a production plan during the peak export window (October–March) can mean missing the shipment window entirely and paying airfreight premiums. In Coimbatore’s job-shop engineering units, where custom orders run alongside repeat production, schedule adherence across multiple job types is a complex daily challenge that most factories still manage with manual Kanban boards and supervisor memory.
Schedule adherence is the canary in the coal mine. Every other KPI problem shows up here first. An OEE drop hits it. A quality rejection problem hits it. A material shortage hits it. A key operator absent hits it. A CEO dashboard that shows live schedule adherence against target — with variance explanation — is the earliest possible warning system for anything going wrong in your factory.
What it tells a South Indian CEO: Manufacturers who improve schedule adherence from 78% to 95% consistently see downstream improvements in OTD, cost per unit, and inventory within 60–90 days — because the entire factory starts operating with predictability instead of reactive firefighting. This single KPI improvement has the highest cross-functional ROI of anything on this list.
All 7 KPIs — Your South India Reference Card
Print this out. Put it in front of your team. And ask which of these numbers you can see on a single screen — right now, without calling anyone.
| # | KPI | Formula | Target | Most Relevant For |
|---|---|---|---|---|
| 01 | OEE | Availability × Performance × Quality | 85%+ | All — pumps, foundry, textiles, auto |
| 02 | First Pass Yield | Good Units 1st Time / Total × 100 | 98%+ | Auto components, garments, precision |
| 03 | Unplanned Downtime | Unplanned Hrs / Scheduled Hrs × 100 | Below 5% | Textile machinery, CNC shops, foundry |
| 04 | On-Time Delivery | On-Time Orders / Total Orders × 100 | 95–98%+ | Tirupur exporters, auto suppliers |
| 05 | Cost Per Unit | Total Mfg Cost / Good Units Produced | ↓ 3–5%/year | All — especially volatile raw material users |
| 06 | Inventory Turnover | COGS / Average Inventory Value | 6–12× / year | Pump clusters, foundry, job shops |
| 07 | Schedule Adherence | Actual Output / Planned Output × 100 | 95%+ | All — especially multi-product SMEs |
South India is the fastest-growing manufacturing region in India at 7.72% CAGR to 2031. Tamil Nadu attracted USD 6.2 billion in electronics FDI in FY 2025 alone. The manufacturers who will lead this growth cycle are not necessarily those with the best machines or the biggest factories — they are the ones who can see their performance clearly and act on it quickly. A seven-KPI dashboard is how that clarity is built.
See All 7 KPIs Live on One Dashboard — Built for South Indian Factories
Stall G161Ascent24 Technologies is a Coimbatore-based custom software and digital transformation company — and we understand South Indian manufacturing because we’re part of that ecosystem. At INTEC 2026, Stall G161, we’ll be demonstrating live dashboards built specifically for manufacturers in Tamil Nadu, Karnataka, Andhra Pradesh, and Kerala.
Whether you run a pump unit in Coimbatore, a garment factory in Tirupur, a CNC shop in Hosur, or an auto-component plant supplying Chennai’s corridor — we build the custom software that puts all 7 of these KPIs on one screen, live, without manual data entry.
4–8 June 2026 · CODISSIA Trade Fair Complex, Coimbatore, Tamil Nadu · Ascent24 Technologies to Showcase AI & Automation at INTEC 2026 Coimbatore — Stall G161